2013 Q1 | It’s the Fed, Stupid
It’s the Economy, Stupid — Bill Clinton, 1992
It’s the Fed, Stupid — Hardesty Capital Management, 2013
The stock market performed exceptionally well in the first quarter of 2013. In fact, the Dow Jones Industrial Average broke through its 2007 high of 14,400 on March 11 and finished the quarter with a total return of 11.9%. The S&P 500 flirted with its all-time high and closed the quarter at 1,569, just above its former peak of 1,565, and had a total return of 10.6%.
Also notable was the failure of the bond market to keep pace with the stock market, confirming our long-held fears that the bond market was vulnerable to a rise in yields, which occurred in the quarter. The 10-year Treasury yield rose from an all-time low of 1.41% in July 2012 to 2.06% on March 11, only to fall back to 1.86% by March 31. With interest rates at such low levels, even small movements resulted in extraordinary price volatility, both up and down, in bonds.
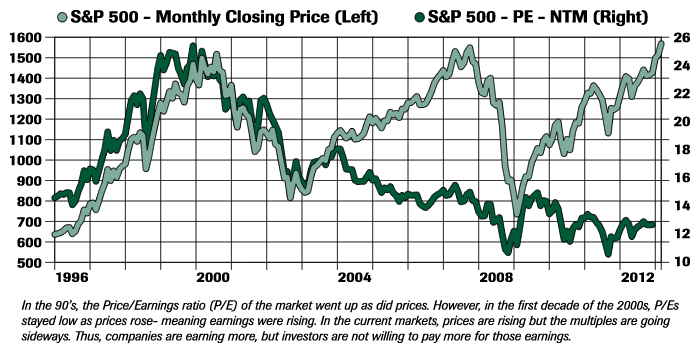
Since the S&P 500’s closing low of 683 on March 6, 2009, the index has recovered 130% to 1,569. It took the S&P over 4 years to recover to its old highs. Investors have remained fearful of equities long after the 2009 lows were established. As the chart on the next page indicates, large outflows of funds from equity mutual funds continued almost monthly until early 2013. The big gains in equity prices have been accompanied by large increases in earnings. This means that the market is paying the same (or even lower!) price per dollar of earnings. As a result, valuations remain very reasonable (see chart, back page). In addition, many retail stock brokers report strong resistance on the part of small investors to increasing exposure to equities. Perverse as this may sound, the absence of the small investor provides a large reservoir of funds for future equity investment, which in turn will support or even increase equity prices down the road.
The big gains in equity prices have been accompanied by large increases in earnings. This means that the market is paying the same (or even a lower!) price per dollar of earnings. As a result, valuations remain very reasonable (see chart, back page). In the post WWII era, equity prices have generally traded between 10 and 20 times earnings. Higher multiples (17 to 20 times earnings) have been associated with periods of lower inflation (0 to 3%), while lower multiples (10-12 times earnings) are common when inflation rates are high (5% or more). With inflation forecasted at 2% over the next several quarters, a higher multiple of 15-18 times earnings seems justified, which would suggest an S&P 500 value of 1660-2000, or 6-27% above recent levels.
The second factor influencing share prices is the Federal Reserve’s monetary policy. In 2010, the Fed announced a policy of quantitative easing, which meant the government would increase liquidity and the money supply to the banking system— as long as inflation remained below 2.5%. In 2012, the Fed outlined a second condition before they would withdraw this liquidity. Specifically, the new metric requires unemployment to fall below 6.5%. These policies make it more clear to the public what the quantitative triggers will be for acting on the Fed’s dual mandate, which is to keep inflation low and employment high.
As the recovery unfolds, investors are expressing concerns as to what will happen to equity prices when the Fed reduces its supply of liquidity to the banking system. When a rate increase is announced, we would expect the first days of tightening to be sharply negative days for equities, possibly down 5% or more. However, any increase in rates will be some time in the future, probably 2014 at the earliest. In any case, the anticipated correction would be short lived.
A quick reference to the monetary playbooks of the 1950s and the 1960s would offer a reasonable guide to forecast a monetary cycle. In the first part of the cycle, the need for tightening would be the result of economic strength. Economic gains would be reflected by a stronger employment pattern which would lead to higher income tax receipts and lower deficits. The improving economy would also produce higher corporate profits, larger business tax receipts and in turn underpin higher stock prices. In the second part of the cycle, early warning signs of rising inflationary pressures would occur, reflecting increases in commodity prices as well as labor rates. Stock prices would likely stall. Finally, as the economic cycle continued to overheat, the more speculative sectors of the stock market would assume leadership status and initial public offerings market would also heat up, signaling the end of the stock market advance. Historically, the market has absorbed the monetary restraint and has always moved on to all-time highs.
[blockquote4 align=”left|center|right” textalign=”left|center|right” width=”30%”] The absence of the small investor provides a large reservoir of funds for future equity investment.[/blockquote4]In the 1950s, stock market forecasters developed a theory known as the “three steps and stumble” rule. The theory suggested that only after three consecutive increases in interest rates (generally measured by the Fed Funds rate, the rate at which banks lend each other money for short periods) was evidence provided that the Fed was serious about slowing an overheating economy. This led to a fall in share prices. Higher interest rates would increase economic costs, reducing profits and thus causing businesses to cease or curtail expansion plans, resulting in an economic slowdown or even recession.
 In fact, slowing the economy without triggering a recession has proven difficult. In 1957, the strength of the economy led the Federal Reserve to implement seven successive increases in the discount rate between April of 1955 and August of 1957. The Dow fell 19% from a peak of 521 July 21, 1957 to 420 October 22, 1957. The economy, lacking liquidity and impacted by higher interest rates, tumbled into a short but severe six month recession beginning in October of 1957 and ending in April of 1958.
Again in 1965 and 1966, the Federal Reserve, chaired by William McChesney Martin (1951-1970), engineered a series of interest rate increases in large part because Martin was unwilling to fund President Johnson’s Vietnam War. A Texas standoff occurred in December 1965 when Martin, a guest at the LBJ ranch, refused to print money to fund the war. Martin was summarily sent back to Washington in the middle of his scheduled weekend visit. By mid-1966 the bank prime rate was at a post WWII high of 6%, and money center banks were starved for liquidity as recession began to spread through the economy in the second half of 1966. The impasse continued through the first eight months of 1966: Johnson spending on his war and Martin holding firm on liquidity. Martin blinked over Labor Day weekend 1966 when Manufacturers Hanover Bank, a major New York institution, alerted the Fed it was nearly insolvent. The bank sought emergency access to liquidity from the Fed. Martin opened the discount window (the nation’s lender of last resort) and saved the bank, but he sowed the seeds of the inflation of the 1970s.
The most extreme example of monetary policy in modern times occurred during Chairman Volcker’s years, from 1979-1986. In October 1979, the US was experiencing 12% inflation brought on by a global commodities boom and the excessive deficit spending of the Carter administration. In an October 1979 speech, the Federal Reserve Chairman declared he would pursue extremely restrictive monetary policies to bring inflation under control. The resulting gradual increases in the Fed Funds rate resulted in an increase in the lending rate from 11% in September 1979 to 20% in late February of 1980. Even more striking was the increase in the newly-minted 30-year Treasury bond rate from 9% in the fall of 1979 to 14.87% in October 1981. Stocks were hammered, falling 17% from peak-to-trough between February and April 1980. Though a severe recession predictably followed, the Volcker prescription for breaking the backbone of inflation was successful and the economy began a boom that lasted for nearly 20 years, from 1982-2000. Conclusion: Don’t fight the Fed.
Returning to the present, the domestic economy scored further gains in the first quarter, with the forecasters’ range for GDP growth in the March quarter for 2% to 3.5%, an unusually large spread for a single quarter already in its third month. On the positive side, housing (~15% of the economy) and autos (~3-3.5% of the economy) posted excellent results. Consumer confidence, unemployment levels, and leading economic indicators all evidenced stable or improving trends in the quarter.
Two important changes occurred in early January that could impact the economy for the balance of 2013. The 2010 2% reduction in the FICA or Social Security tax expired on January 1, 2013, effectively reducing take home pay by 2% of earned incomes under $110,100. Based on a median household income of $60,000, the average worker’s after-tax paycheck was reduced by $1,200 on an annual basis, a considerable burden on many middle class families. Second, Congress and the President increased taxes on the wealthy (defined as the top 1% of taxpayers) by $60 billion annually, or by an average of $48,000 for each household fortunate enough to be in that category. These new taxes may negatively impact the overall American consumer’s spending, potentially slowing the recovery.
[blockquote4 align=”left|center|right” textalign=”left|center|right” width=”30%”] Slowing the economy without triggering a recession has proven difficult. [/blockquote4]Contributing to our nervousness is a report by Walmart of a sudden sharp decline in sales in February, suggesting middle-class spending patterns have slowed. Also, McDonald’s reported weakening sales trends in February, despite significantly increased promotional pricing programs. In addition, a friend of our firm operates a large chain of convenience stores in the Mid-Atlantic area. He noted a sudden and sharp slowdown in sales shortly after the beginning of the year. This was a surprise. This company experienced many years of steady growth fueled, in his opinion, by its proximity to Washington, D.C. He expressed concern that the sequestration might be impacting his market territory to a greater extent than the rest of the country.

In the aftermath of the 2008-2009 mortgage-backed security bust, the Fed eased rates essentially to zero and flooded the system with liquidity, a very sound response to the crisis. However, the reluctance of lenders to lend to all but the most creditworthy borrowers and the resistance of well-qualified but cautious borrowers to take out loans has resulted in a very modest economic recovery to date when compared to other recessions. Sooner or later, business confidence will recover and loan demand will pick up, potentially to the point the Federal Reserve will be pressured to raise interest rates and drain liquidity from the economy. As discussed above, this could have an adverse impact on the level of equity prices depending on the degree of advance from current levels. However, this dynamic should not play out until well into the future.
Historically, the first year of a presidents term has posted the weakest equity results of the four year cycle. Given the strong first quarter start, we remain optimistic that we can avoid the past precedents: the current and projected low inflation rates and continued monetary easing should lead to at least moderate economic expansion. The Fed’s stated trigger points for tighter money policies are unlikely to be tripped. But if they were, it would result in the end of the economic recovery. Finally, all of this points to continued prospects for record corporate earnings, leading to the conclusion that further advances in equity prices are justified. We now believe the S&P 500 could exceed 1,650 this year, a gain of 5.2% from current levels, and a full-year gain of 12.8% in 2013.
We find little reason for optimism on bonds. First, rates are lower than at any time since the Depression. Second, the U.S. bond markets have acted as a safe haven for foreign fixed income managers. These investors have sought to escape the very high volatility levels associated with several countries experiencing emergencies or near emergencies within the European monetary system- including Cyprus, Italy, Greece, and Spain.
[blockquote4 align=”left|center|right” textalign=”left|center|right” width=”30%”] All of these things point to continued prospects for record corporate earnings, leading to the conclusion that further advances in equity prices are justified. [/blockquote4]An old Wall Street sap suggests that “markets climb a wall of worry.” Certainly there is much to worry about. Today a pessimist can find much to fear and even wallow in a sea of depression. We prefer to see the glass more than half full. We believe America’s economic engine will once again lead the world to solid economic growth, fueled by Mr. Bernanke and the Federal Reserve System. I, for one, am becoming more optimistic.


