2010 Q3 | One Step Back, Two Steps Forward
 The third quarter of 2010 was a remarkable one for stocks and bonds. As is rarely the case, both performed exceptionally well. We do not anticipate this unusual trend will continue much longer. It is, however, very nice to have both major components of our clients’ portfolios performing so well at the same time.
A major reason for the strong quarter in stocks was the shift in the consensus view of the economy. In the beginning of the quarter, most pundits (not us, I might add) were calling for a “double-dip” recession. This was a step backwards for the market. By the end of August, that view began to shift towards our belief that the economy would avoid another recession. Clearly, two steps forward. Sentiment shifted because the economic data overall began to turn slightly more positive. With this shift in sentiment, the market rallied. By the end of the quarter, the Dow Jones Industrial Average was almost back to 11,000.
Volatility in returns was very high during the quarter. The S&P 500 was up 6.85% in July, down 4.38% in August, and up an incredible 9.8% in September. As an aside, this was the best September since 1939. For the quarter, the S&P 500 was up 11.3%, nearly wiping out the second quarter’s loss of 11.45%. For the first nine months of the year, the S&P 500 is up 3.89%.
Just as the stock market performed well during the quarter, so too did the bond market, but for completely different reasons. Money continues to flow into bond mutual funds. So far this year, $243 billion has poured into bond funds while $61 billion has moved out of stock funds. This cash inflow, combined with foreign investors fleeing the troubled sovereign debt of other countries, pushed yields on Treasuries to historically low levels. As yields on bonds drop, prices increase, which translates into good returns. The Barclays Government/Corporate Intermediate Index, a commonly used bond index comprised of investment grade corporate and government bonds, was up 2.76% in the quarter. The Barclays Municipal 7 Year Index, an index of country-wide municipal bonds, was up 3.50%. Year-to-date, the indexes are up 7.44% and 7.17%, respectively.
Historically low interest rates translate to no immediate concern on the inflationary front. This is good news, as inflation is the enemy of financial assets. The Consumer Price Index was up a modest 1.1% over the last twelve months. This rise reflects the 1.8% increase in the employment cost index and continued productivity gains sufficient to offset wage increases. So far, this has not yet turned into new job creation, but we remain optimistic that it will.
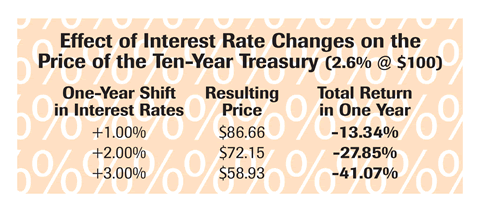
When inflation is low, bond valuations tend to be higher. We are, however, becoming increasingly concerned over the valuation of the bond market. As yields are hitting historic lows, money continues to flow into this asset class. While we are not prepared to label the bond market a “bubble,” we do think bonds in general are somewhat overvalued. Ten-year treasuries currently trade at 2.53%. As the accompanying table suggests, a 1% increase in rates could equate to a 13.34% loss in value. A 2% increase in yield from the current level might mean a 27.85% loss in value. To put this in perspective, a 10-year Treasury purchased today for $25,000 would be worth approximately $18,000 if rates increase by 2% within a year. Our approach to this segment remains the same: caution with purchases, which are limited to shorter-duration bonds. We continue to think that bond yields will begin to rise as the economy improves.
The economy is improving in spite of what is being reported in the press. Although slowing from the 3.7% growth experienced in the first quarter, we anticipate the economy will expand between 2% and 3% the remainder of the year. It is normal for the economy to show strong growth coming out of a recession followed by more modest growth rates in later quarters. There is no question this recovery is more muted than we would like it to be, but it is a recovery nonetheless.
One segment of the economy that has performed well is durable goods. Factory orders and shipments both had healthy increases in the quarter. Steel shipments were up, but still the mills were operating at under capacity. We have heard that steel production may be scaled back, which makes us somewhat cautious. Many of our clients own shares of Nucor, America’s largest steel company. Clearly, we think the long-term fundamentals are in place for economic expansion or we would not be holding shares in this company, which is a proxy for the steel industry and the overall economy.
Employment is the key economic indicator driving markets. Although job growth has been somewhat slower to materialize than we would have liked, we are starting to see some progress on that front. Weekly unemployment claims improved every week in August. The unemployment rate remains stubbornly high but that could start to change if companies’ confidence in the recovery improves. In addition, some of the uncertainties facing corporations, like healthcare reform and financial regulatory reform, are beginning to reach a conclusion.
Housing remains a big question mark. It comprises 15.5% of our economy, down from a peak of 20%. Interestingly enough, housing is broken down into two segments: residential fixed investment (construction) and housing services (everything that goes into maintaining your home). Notice that housing services have performed exceptionally well during the downturn (see table). Residential fixed investment, on the other hand, dropped by 56% from 2005 to 2009. Although the residential fixed investment portion of total housing only equates to 2.4% of our economy, it would go a long way to putting us back on good footing. With interest rates for thirty-year fixed mortgages below 4.5%, we believe that the consumer will purchase more new and existing housing, clearing excess inventory and boosting the construction trades. Yet sales remain lackluster due to the job market. Improvements in housing should also lead to a reduction in the unemployment rate.
The U.S. economy will be almost $15 trillion by the end of this year, a new record. According to the International Monetary Fund, our economy makes up almost 25% of world GDP. The second largest economy is now China, which just surpassed Japan’s $4 trillion economy this quarter. To be sure, Asia has captured a number of our mature markets, especially in manufacturing. The reason for this shift has its basis in the fact that U.S. per capita income is $46,381 while China’s is just $6,567 (International Monetary Fund – 2009). With this type of wage differential, lower-skill jobs will naturally gravitate toward lower-cost labor pools in a global market. It is often written, “We don’t make anything in this country anymore,” which is an obvious reference to this phenomenon. But consider this: our manufacturing base represents 20% of our gross domestic product, or around $3 trillion of output. This level of production equates to over three quarters of the entire Chinese economy. Moreover, our economy is very resilient, as we have transitioned to higher skilled areas like biotechnology, technology, healthcare and advanced education.
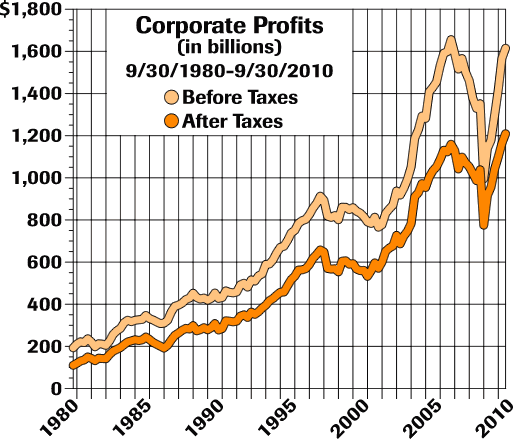
With the economy in slow recovery, one area that has not been slow to recover has been corporate profits (see chart). During the recession, companies reduced headcount much more quickly than in previous recessions. As the economy recovered, corporate profits grew rapidly, as expenses were much lower. So far, the market has not rewarded companies for managing the downturn as well as they did. While profits have almost fully recovered, stock prices have not. Prices for stocks, as measured by the S&P 500, are still 26% off the prior peak. Our take-away from this is that the market is still pricing in a lot of uncertainty.
——————————————————————-
One area that has not been slow to recover has been corporate profits.
——————————————————————-
Based on historic price-to-earnings valuations, equities are at the low end of their range of ten to twenty times. Current consensus estimates for 2011 indicate the S&P 500 Index is selling at 12.9 times projected earnings of $89, up from $80 for 2010. If these estimates are correct, common stocks are currently inexpensive. So what might explain the low valuations?
Inflation, another crucial variable to valuing stocks, may be one answer. The U.S. is currently running very large deficits, both in absolute dollars and as a percentage of gross domestic product. These deficits could lead to an increase in inflation. Higher inflation leads to lower P/E multiples. Inflation data bears close watching. In addition concerns over future inflation, stocks are inexpensive due to uncertainties surrounding the economy, taxes, healthcare and financial regulatory reform. We remain convinced that these uncertainties are being resolved.
There are those that are saying that future generations will not live as well as I have. I say rubbish. Our firm has had a number of young men and women as interns and employees. They are diverse, creative, smart, and computer-savvy. Many years ago, my late father said to me, “I’m glad you’re coming and I’m going.” My view of the future is quite different. I see a new generation full of promise. I honestly believe the best is yet to come.


