2009 Q1 | Bear Market Rally?
 Is this rally for real? On March 6, the S&P 500 hit a low of 666.8. Since then, the index is up to 797.9, a very impressive recovery in a short period of time. In the closing three weeks of the quarter, we have seen a 16.8% gain in the index. Investors are cautious, however— we have seen promising 10% gains wiped out three times since September. This gut-wrenching market appears to be pricing in a tremendous amount of bad news. Hope that the Obama administration would usher in a more optimistic mood was quickly dashed as the S&P 500 in January and February returned -8.3% and -10.8%, respectively. For the quarter, the S&P was down 10.9%.
To be sure, the recent economic numbers remain gloomy. The Gross Domestic Product fell at an annual rate of 6.3% in the fourth quarter of 2008. A similar decline is likely in the first quarter of 2009. This is the worst back-to-back quarterly performance since the fourth quarter of 1981 and first quarter of 1982. Unemployment spiked to 8.1% and will likely go higher, possibly exceeding 10% in the second half of 2009. The manufacturing and service sectors both continue to contract. All in all, the economy is performing very poorly.
There are, however, early signs of economic stability. The housing market is showing glimmers of hope as new home starts are up and housing affordability is at record highs. Inflation, the enemy of financial assets, is well under control as commodity prices have fallen dramatically from their speculative excesses. Historically low interest rates, combined with government-led programs, have allowed the credit markets to return to some semblance of normalcy. Finally, the strengthening dollar is a very good indication that the economy is beginning to turn.
In addition to these economic signs, the financial sector appears to be improving. Financial stocks must take the lead as a precondition for an economic and market recovery. This could have started in March as Morgan Stanley, Goldman Sachs, Citigroup, and Bank of America all enjoyed large gains relative to the market index. Interest rates remain low, maintained by a determined Federal Reserve Bank hell-bent on avoiding deflation. Just as in the 1990-91 recession, banks are beginning to see a sharp increase in their net interest margin (a proxy for their revenues). Coupled with much more stringent cost controls, this should translate into significantly higher profit levels. Simply put, banks should earn their way out of this malaise.
While the Federal Reserve continues to wrestle with the tasks of balancing deflation and inflation, the Obama administration has decided to change its tone from a negative view of the economic situation to a more positive outlook. In addition, Treasury Secretary Geithner clarified his position by providing details on the government programs designed to stabilize the financial system. This was a huge momentum changer for the market, as the lack of details and confusion drove the markets to their low point in early March.
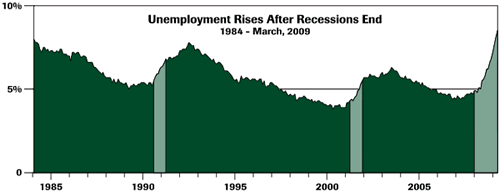
Even though unemployment is negatively impacting consumer confidence, the markets tend to be a leading indicator whereas unemployment is a lagging indicator. In fact, joblessness will increase even after the economy has turned up (see chart). Housing, on the other hand, is a leading indicator, and as stated earlier, there are signs of improvement in that sector.
– – – – – – – – – – – – – – – – – – – – – – – – – – – – – – – – – – – – – – – – – –
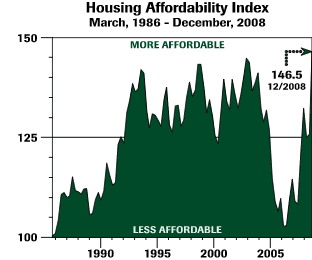
The key turning point of this economy may have been reached when the housing affordability index
recovered to a new all-time high.
– – – – – – – – – – – – – – – – – – – – – – – – – – – – – – – – – – – – – – – – – –
Other evidence of stabilization in the economy includes strength in technology spending, commodity prices bottoming, and improving consumer balance sheets resulting from a sharp increase in savings. The interesting aspect of the increased savings rate is what is known as the “paradox of thrift.” Consumers have abruptly increased their savings rates from essentially 0% to 4.3% in the space of one year. Every dollar we save translates to a dollar less in income for someone. This shift has withdrawn $400 billion of spending from the economy, resulting in a multiplier effect that has a strongly negative impact on the Gross Domestic Product. In the long run, however, higher savings rates ultimately drive economic growth. This is in direct contrast to the Bush administration’s approach to the economic situation.

The Bush administration correctly sought and received $700 billion in the Treasury Asset Recovery Program (TARP) legislation passed on October 3, 2008. Rather than inject these monies directly into the economy, former Treasury Secretary Paulson chose to put $300 billion into the ten largest banks in the country, hoping they would loan the money to the private sector. Frightened by increasing loan losses, the banks chose to invest the money. The remaining $400 billion under the Bush program still remains unspent. The $500 billion consumer retrenchment was not successfully addressed under the program.
As soon as President Obama took office, he began work on a new stimulus plan. The $800 billion bill was passed on February 13. Unfortunately, this plan has been relatively slow to start spending, but by quarter’s end important distributions were being made to state and local governments. Significantly, more funding should be available in the second half of 2009 and could bring with it some meaningful economic relief.

The key turning point of this economy may have been reached when the housing affordability index recovered to a new all-time high (see chart). Now is the time to buy a house. Mortgage rates fell sharply to under 4.5% in some areas. Yale professors Karl Case and Robert Schiller correctly predicted the housing price collapse. The authors of the well-known Case-Schiller home price index now feel a housing bottom is near.
The short-term outlook for stocks remains uncertain. The very rapid fall in economic activity was surprising in both speed and magnitude. The result is a large reduction to our internal earnings forecast. With this lowered forecast comes a commensurate drop in valuation levels. Our estimate for S&P 500 earnings for 2009 is now $55 to $60 a share, down from $90 – $100 a share from mid-July 2008. Historically, price-earnings multipliers rise in recessionary periods. Using a midpoint of 15 times earnings on a depressed $60 per share earnings estimate for the S&P 500 Index, share prices could push the index up to 900. This equates to a 12.8% increase above quarter-end closing prices by the end of the year.
– – – – – – – – – – – – – – – – – – – – – – – – – – – – – – – – – – – – – – – – – –
With so much liquidity in the system, a significant rate increase is possible as the economy recovers.
– – – – – – – – – – – – – – – – – – – – – – – – – – – – – – – – – – – – – – – – – –
Due to the Federal Reserve’s policy of keeping the Fed Funds rate near 0%, bond prices remained virtually unchanged for the quarter. Even though bond prices were stable, they provided some offset to lower stock prices. With so much liquidity in the system, a significant rate increase is possible as the economy recovers. At the end of 2008, interest rates on municipal and corporate debt skyrocketed. As a result, our firm purchased bonds with longer maturities in an attempt to take advantage of these higher rates. Since then, rates have come back down. We have returned to our prior strategy of buying short maturities to preserve our financial flexibility.
The rally since the March 6 low appears to be real. Evidence of economic stability leads us to believe the equity markets have seen a bottom. Due to the tenuous economic environment, we are not yet prepared to make a significant tactical asset allocation recommendation to our clients. We do, however, believe that time is quickly approaching.
—Jim Hardesty


