2011 Q4 | The 2011 Roller Coaster
 When I was a young boy of ten or eleven, the smartest guy in my class enticed me to take a roller coaster ride with him on class day at Baltimore’s old Gwynn Oak park. Mistakenly thinking he was an experienced rider, we jumped into the last car, which my friend assured me was the safest. Only later did I realize he had never ridden a roller coaster and the last car experiences the most violent movements. We both stepped out of the car terrified by the experience. For me, it was to be my first and last ride on a roller coaster. As I look back at 2011, financially, this was much like that roller coaster ride of 50 years ago. The global financial markets rocked and swerved all over the place, only to finish near where they started. The experience was not as frightening as that real ride, but the markets in 2011 were nonetheless unpleasant.
After the very sharp stock market decline in the third quarter, the equity markets gave us a holiday present, advancing 12% in the fourth quarter, bringing the full year total return to the S&P 500 to 2%. However, 2011’s results were punctuated by over 100 trading days where the Dow Jones Industrial Average closed up or down more than 100 points and experienced 16 days where the Dow advanced or declined by over 200 points. This comes in the context of 252 trading days in a year. These levels of volatility are beat out recently only by those seen in the recession years of 2008 and 2002.
 There appear to be many reasons for today’s volatility. First among them is concern as to the viability of the Euro and its banking system. Established in 1999, the Euro has 23 members, including 17 of the 27 member states of the European Union, who collectively agreed to maintain financial discipline as a condition to adopting a single currency. To my surprise, the system functioned fairly smoothly for the first decade. Only recently have we learned that despite assurances from very high government officials of each of the participants that they were in compliance with the required financial standards, several nations had failed to meet their commitments. This has resulted in a very difficult game of beggar-thy-neighbor within the Union, where the weak countries sought assistance from the strong in return for new promises to behave themselves, even though they have proven to have been less than candid about the state of their finances. These developments have had a very negative effect on all European stock markets as they await the German financial juggernauts’ decision as to whether they will come to the aid of their “brother” countries.
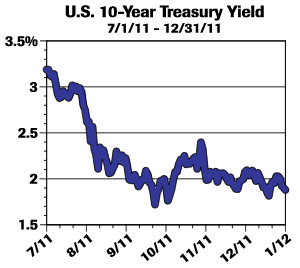
A second surprise in 2011 was the August downgrade by Standard and Poor’s of the credit rating of U.S. Treasury securities. On the surface, this would appear to have been a negative development for the entire U.S. credit market, but global investors realized the downgrade of the US treasuries underscored the precarious positions of many other sovereign debt issuers, even though they may have been rated higher than the U.S. These other sovereign nations were recognized as vulnerable to an even sharper reduction of ratings than what occurred in the U.S. The unexpected consequence of these developments was a significant flight to quality into the U.S. credit markets, resulting in a significant fall in interest rates and an increase in Treasury securities’ prices. As can be seen in the accompanying charts, the interest rate has steadily fallen from the date of the S&P downgrade, August 5th.
A third surprise was the unexpected bankruptcy of MF Global, a small institutional bond trading firm, headed by a former Goldman Sachs chief and ex-New Jersey governor, Jon Corzine. Corzine, in office less than a year, embarked on highly speculative trading practices, attempting to capitalize on the European debt crisis. His trades proved to be disastrous, and the firm plunged into bankruptcy on October 31, 2011, but not before client accounts were looted of $1.2 billion. Again, the culprit was excess leverage (borrowing), which was responsible for the bankruptcies of Bear Stearns and Lehman Brothers in 2008.
 When the final 2011 tally is in, The U.S. should have experienced four quarters of economic growth, probably silencing the doomsayers who are still waving the double-dip recession flag. Turning to 2012, we are closely watching the result of the Christmas retail selling season, which jumped off to a fast start, faltered in the first two weeks in December, and finished strong, aided by significant discounting in the final week before Christmas. When retailers report inventory levels as of their fiscal year end, January 31, we will have a more accurate gauge of how strong the economy will be in the first half of 2012.
One of the more complicating factors in analyzing retail sales has been the emergence of the internet as a very material component of total retail sales. It was reported by IBM’s Smarter Commerce unit that 7% of online purchases were made by someone using an iPad! Another Wall Street forecaster believes that 30% of total retail Christmas purchases were made over the internet. At this point, the consumer appears to be benefitting from lower pricing available on the internet, but this is coming at the expense of traditional retailers’ (those who do not have an online presence) profits, which could be disappointing when announced in early February.
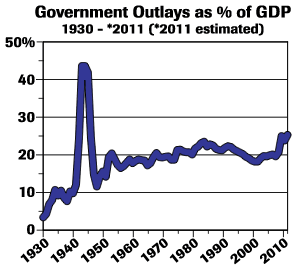
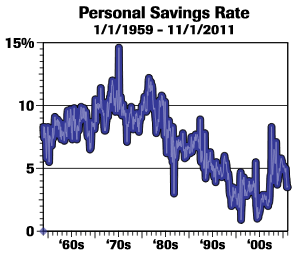
The outlook for the U.S economy in 2012 is reasonably good. Since the 2008-2009 recession, consumer balance sheets have improved as a result of increased savings rates, which were negligible prior to the recession, and are currently running at about 3.5% of income (see chart). Though savings are still low by historic standards, the overall position of the consumer has improved. The consumer sector of the economy is critical, as it accounts for approximately 68% of the U.S. gross domestic product (GDP). Excluding the housing and housing services sectors (17-18% of GDP), most consumer companies are poised for a decent year in 2012, lending confidence that the recovery will continue, albeit slowly. Capital spending (~18% of GDP) was strong in 2011 as a result of a one-year tax moratorium that permitted capital spending programs to be 100% expensed at the time of investment. This sharply reduced corporate tax liabilities, and set the stage for increased cash flows in 2012 and beyond. Somewhat worrisome is the fact that this tax benefit is scheduled to expire on January 1, 2012, which could slow business spending this year. Finally, government spending currently represents 25% of GDP— a very high level by historical standards (see chart). Approximately 2-4% of the recent increase in the government’s share of GDP is accounted for by mandated safety net programs (unemployment programs, food stamps, etc.) that have been necessitated by the recession and the very slow recovery. Adding it all up: consumer spending of 68% of GDP, business and private investment of 18%, and government spending of 25% sums to 111%. The resultant deficit is a high number by any historical standard. I would be comfortable with a deficit of 3-4% of GDP, or roughly equal to our savings rate.
 Sooner or later we must address the fact that the entitlement programs are the driving force that is pushing government spending to uncomfortable levels. The good news is that people are living much longer, but the stress and design limits of Social Security and Medicare never anticipated this rapid increase in life expectancies. However unpalatable, sooner or later we must extend the age at which one can begin to collect benefits from both Social Security and Medicare, if for no other reason than to reflect the new actuarial realities that have resulted from enormous advances in the medical field. In fact, we have already increased the age for which participants can receive social security benefits, as a result of 1983 legislation which was recommended by the Greenspan Commission. Today we have a framework in the Simpson-Bowles proposal, which closely parallels many of the ideas put forth in the Greenspan Commission. These proposals would diffuse, at least for the near term, deficit pressures.
It is too soon to say whether we will step on another economic roller coaster in 2012. Several issues remain to be resolved for a sustained economic recovery in this country. First, housing prices need to stabilize, and there is early evidence that this is occurring. This, in turn, should be reflected in increased consumer confidence, as well as increased consumer purchases of durable goods— something that is presently evidenced by the 7.5% increase in automobile sales in 2011. These expectations are supported by the Federal Reserve’s outlook for interest rates through 2012, pointing to a continuation of the current low levels, which will support housing and durable goods purchases.
Against this backdrop, we expect a favorable environment for financial assets. Specifically, we believe interest rates, as measured by the 10-year U.S. Treasury, will remain in a range of 1.75%-2.75% this year. Assuming S&P earnings of $100 per share, which itself assumes overseas economies experience only a moderate slowdown in growth, the S&P 500 could well reach 1400 on a historically conservative 14 times earnings multiplier and produce a price return of 11%. This could bring to a close the amusement park phase of this investment cycle, and I certainly hope it does!


