The Stock May Be Healthy, But Does It Have “Bad Breadth”?
By: Chad Meyer, CFA
As we enter the second half of 2023, equity investors look back at an impressive year-to-date stock market performance with the three most popular indices solidly positive. The S&P 500 is up 17% for the year, the Nasdaq Composite has risen a whopping 32% and the Dow Jones Industrial Average (DJIA) finished up 5%.
While one index has performed extremely well over the past six months, why has the Dow been a relative laggard so far this year? One of the main drivers of this is a term known as “market breadth”. Specifically, this year’s market returns have been driven largely by strong gains in a small number of companies. These eye-popping returns have come from companies including Apple (AAPL), Microsoft (MSFT), Nvidia (NVDA) and Meta (META), and the gains are largely related to anticipated future profitability linked to the advent of Artificial Intelligence (AI) applications. These tech behemoths have become so dominant that they have earned a new moniker – the “Magnificent Seven.” Before we get into detail about breadth, let’s take a close look at each of these indices and what drives them. As you’ll learn, each has significantly different components, and these components can have different impacts on the overall index.
Let’s start with the good old Dow Jones Industrial Index (DJIA), America’s original stock index and still its best known. Created in 1896 to track twelve of the nation’s biggest corporate names, the Dow today is made up of thirty blue chip stocks. Most of these companies are household names, including Apple, Coca-Cola (KO) Proctor & Gamble (PG) and Walt Disney (DIS). The DJIA is price-weighted, meaning that moves in the index are determined solely by changes in the thirty stock prices. Companies with higher share prices have larger impacts on Dow performance than do those with lower share prices. As a price-weighted index, the highest priced Dow component (United Health Group (UNH) as of this writing), at about $450 per share, will have a significantly larger effect on the Dow than the lowest priced component (Walgreens Boots (WBA)), which trades at about $30 per share.
Next up is the Standard & Poor’s 500 Index (the S&P 500), which many argue is the closest indicator of how the entire market is truly performing. Started in 1957, the S&P tracks 500 large U.S. stocks. To be selected as a component, a stock must have a market capitalization of $12.7 billion or more, have a public float of at least 10%, have positive earnings for the most recent four quarters and have adequate liquidity as measured by volume and price. The makeup of the S&P seeks to include sector weightings that reflect the true composition of the overall stock market. Currently, approximately 30% of the 500 companies are in the information technology sector, 14% in healthcare, 12% in financials and 10% in consumer discretionary. The top five constituents by index weight are currently Apple, Microsoft, Amazon (AMZN), NVIDIA and Alphabet (GOOG). As you’ve obviously noticed, these five are all part or the technology industry and have direct exposure to the Artificial Intelligence space, an important part of our discussion of market breadth (more on that below…). While the Dow Jones Index is price-weighted, the S&P 500 is market-weighted, so a company’s market value drives index performance (as opposed to the price of a component’s stock). A larger company (based on market capitalization) will have a bigger impact on the overall movement of the S&P than a smaller company (by market capitalization). As another example, let’s look at the biggest market cap company versus the smallest based on market cap. Apple, which recently exceeded $3 trillion in market value, is over 230 times larger than the $13 billion market cap of News Corporation (NWSA). As a result, Apple has a significantly greater impact on the S&P’s performance than NWSA, not because of its share price (like with the Dow) but because of its gigantic market value.
Last but certainly not least is the Nasdaq Composite Index. Dating back to 1971, the Nasdaq is made up of nearly all of the securities traded (over 2500) on the Nasdaq Stock Market. Because the index has a high concentration of technology companies, the Composite is often considered to be a good barometer of how well the overall tech market is performing. Among the most recognizable companies in the Nasdaq Index are Apple, Microsoft, Tesla (TSLA) and Meta. As with the S&P 500, the Nasdaq Composite is market-weighted, so a company’s market value drives index performance.
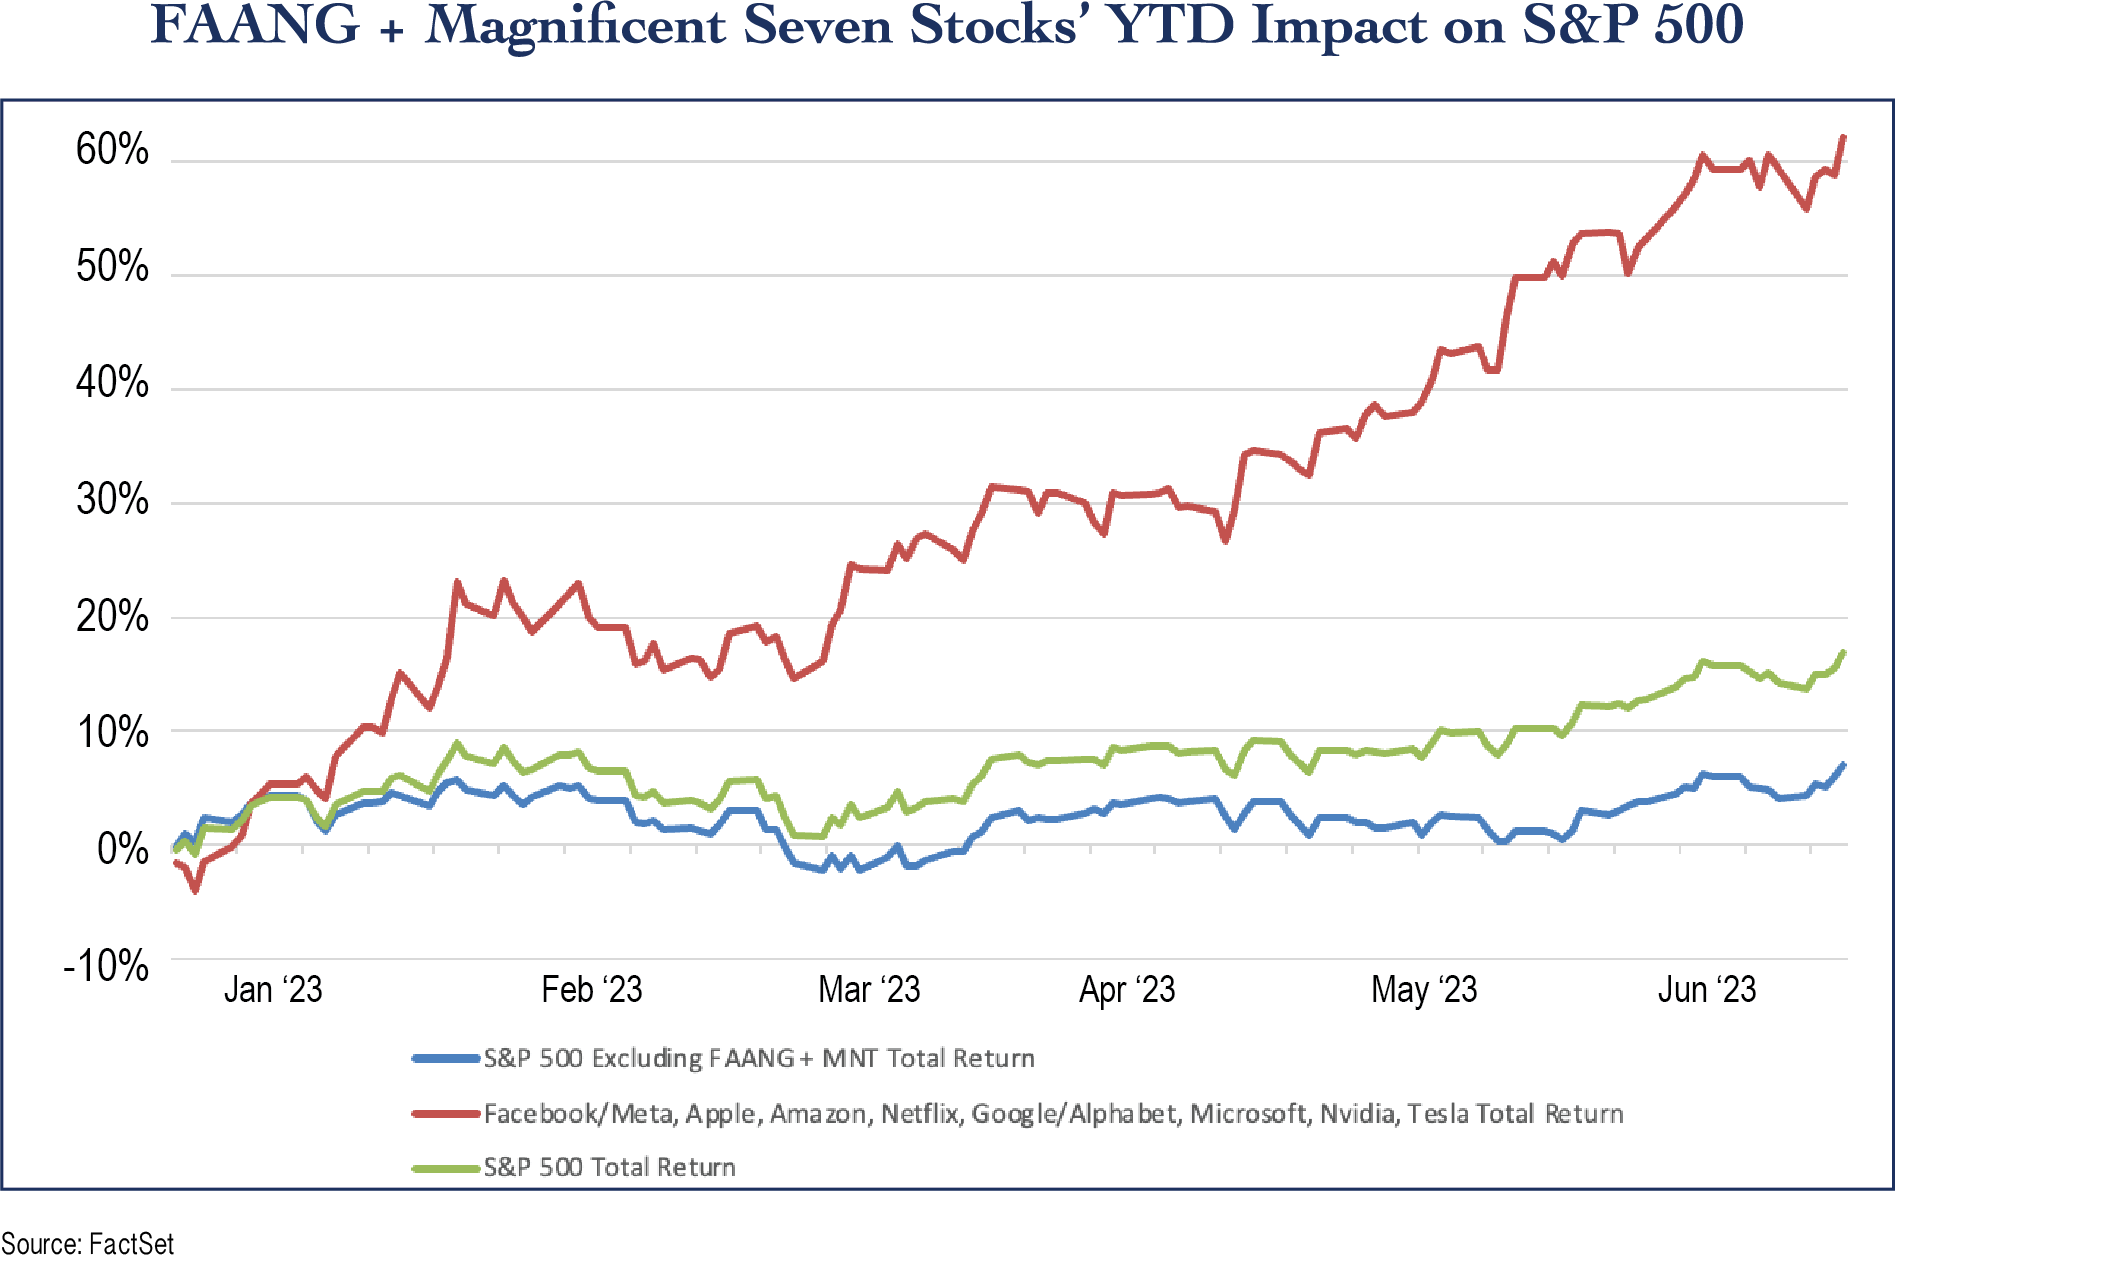
Now that we’ve taken a close look at what makes up these three, let’s get back to market breadth specifically and why some say that the stock market has “bad breadth” so far this year. Market breadth is measured by multiple indicators, but the core idea is that breadth refers to a set of technical indicators that evaluate the price advancement and decline of a stock index. Market breadth represents the total number of stocks that are increasing in price as opposed to the number of stocks that are declining in price. Simply put, a market has higher breadth (“good breadth”) when a larger number of stocks are moving in unison, whether it be up or down. Conversely, “bad breadth” occurs when the overall market is driven by a smaller group of company stocks (as we’ve seen so far in 2023, with big gains in the “Magnificent Seven”, or just about anything associated with Artificial Intelligence, leaving behind the performance of many non-tech sectors).
So, what does today’s “bad breadth” mean for the future? A continuation of this narrow market environment could possibly set investors up for tougher times ahead, since tight market leadership tends to make Wall Street nervous. The outsize influence of just a handful of large companies makes the overall index vulnerable to a downturn if a few big names fall.
On the bright side, as of this July writing, we are starting to see stocks of many companies (beyond tech) participating in the broad market rally. We’re seeing better breadth. More than 140 stocks in the S&P 500 have hit fresh 52-week highs since late May, and all eleven industry sectors have climbed since that period. Wall Street often views improving breadth as a measure of health in the equity market and a promising sign that the rally could last.