The Weekly View (2/12/18)
What’s On Our Minds:
After a long cruise of low volatility and smooth sailing upward, the S&P 500 and DJIA officially dipped into “correction” territory last Thursday as the index shed 3.8% of its value. By definition, a correction is a reverse movement of at least 10% in value for a financial asset. Last week, both indexes officially reached correction territory when they dropped by just over 10% from their peaks that were reached on January 26th.
This correction is the first since the one that ended in mid-February 2016. Back then, investors were worried about a possible recession in the U.S. economy, falling oil prices, and a decrease in value of the Chinese renminbi. The current correction can be linked to worries of rising inflation spurred by an acceleration of global growth.
While it’s tough watching the equity portion of your account drop by 10%, market corrections can be healthy for both the markets and investors. Remember, even though we haven’t experienced any real volatility recently, (up until the past 10 days, that is) historically the stock market can be very volatile on a short-term basis but has a strong track record over the long term.
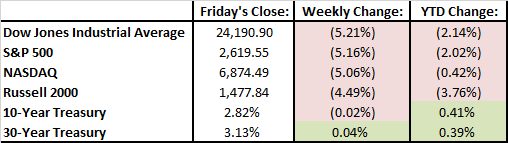
As of Friday’s close, the stock market is down 8.7% from its record high and indices are back to levels where they were in early December of last year. Last week it seemed as if volatility begot more volatility as trades unwound amid a chain reaction where emotion took hold and caused some investors to sell.
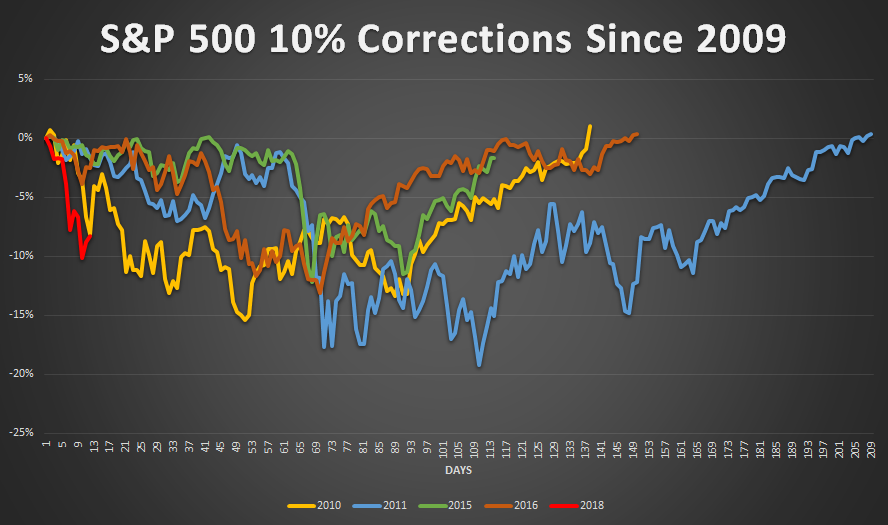
For some perspective, this is the fifth 10% correction we have experienced since the current bull market began its run in 2009. In the chart below, you will notice that it takes some time for the market to find its footing after a correction and to then recover its initial 10% loss. However, in each scenario markets have tested a bottom and recovered to previous levels. (Note: In 2015, the S&P 500 experienced another 10% correction before it reached its previous high.) On average, since 2009, it has taken 220 days for the S&P 500 to recover to its previous high following a 10% correction.
Of course, what has happened during similar situations in the past is not indicative of how this particular correction will play itself out, but one thing is for certain: corrections happen from time to time and they should be expected. Furthermore, in many cases a correction can be viewed as an opportunity for investors to test how comfortable they are with market risk, and to make changes to their portfolio if warranted. Also, corrections present investors an opportunity to potentially add to positions in companies at a discounted price, or to dollar cost average down on existing positions.
Last Week’s Highlights:
It was a volatile week for markets. Equity indices ping ponged up and down and finished the week deeply in the red. Both the Dow Jones and S&P 500 were down 5.2%. The CBOE volatility index spiked to 49 on Tuesday before settling in the mid-30s for much of the week. (The average for this index has been 18.51 since 2004.) Investors are attributing last week’s volatility to rising interest rates and the unwinding of volatility bets that went bad for certain investors.
Looking Ahead:
Earnings season will continue to wrap up this week with 59 companies from the S&P 500 reporting.
On Monday, President Trump is plans to announce a $1.5 trillion infrastructure spending plan.
Wednesday’s inflation report will be very important as much of last week’s volatility was partially spurred by fears that high inflation will be brought on by recent wage growth and economic expansion. Retail sales will also report on Wednesday, followed by consumer sentiment on Friday.