Luck of the Market, Active Management, or Asset Allocation?
The true sources of excess returns
 The decision of how to allocate your money between asset classes (bonds, stocks, international, etc.) is important, we know. But just how important is it? There are many sources that say “over 90%” of your return comes from asset allocation. This oft-quoted statistic comes from a misinterpreted financial study from 1986 (“Determinants of Portfolio Performance,” by Gary P. Brinson, Randolph Hood, and Gilbert L. Beebower, published in the Financial Analysts Journal). What the study said was that asset allocation explained 93.6% of the variation in a portfolio’s quarterly returns. What does “that“ mean?
In fact, even that statistic has been hotly debated and interpreted in many ways. For clarity on this issue, we look to the ever-academic CFA institute, which tells us that, as a rule, “about three-quarters of a typical fund’s variation in time-series returns comes from general market movement, with the remaining portion split roughly evenly between the specific asset allocation and active management.” (Here, “fund” is referring to balanced mutual funds and pension plans.)
This explanation is well and good for the portfolio theorist, but the takeaway for an average investor is that 75% of the variance of your yearly returns (that is, if it rises one year and declines the next) will just be the ups and downs of the market. The rest is half the result of individual investment decisions made by the portfolio’s manager (that’s us), and the other half is the asset allocation decision (again, something we do). You might be thinking that if 75% of the variation is just the market, you might as well do it yourself. But that 25% can mean the difference between a 6% return and an 8% return—well worth the effort of active management and defining an asset allocation.
So we see that the decision on how to divide your money among asset classes is just as important as choosing specifically which stocks, bonds, or other assets in which to invest. Where, then, do we allocate our assets?
There are many “rules of thumb” to guide your asset allocation. There is “100 minus your age” to get the percent of stocks in your portfolio… but some say to use 110, or even 120. However, we think that no rule of thumb can be sufficient to make such an important decision. As you know, we tailor each individual portfolio so it meets your needs.
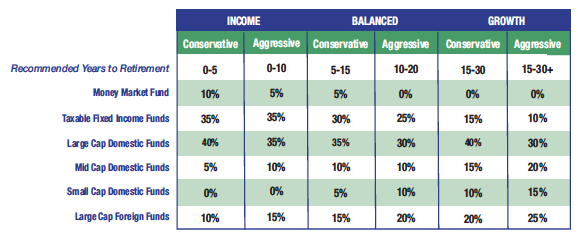
When it comes to a 401(k) account, for example, such detail is not possible. To address this problem, we have developed custom tables for each of our 401(k) clients that list the individual funds they are able to invest in, as well as the recommended percentage they would invest in each fund, given their risk tolerance and time until retirement (see below).
Another advantage of this method is that it avoids the easy fallback of “target date” funds, in which a 401(k) participant selects the date that he or she aims to retire, and the fund managers shift the asset allocation to more conservative areas as the target date approaches. These funds assume everyone who retires in a given year has the same risk tolerance—something that is absurd just on the face of it. What’s more, they often charge a “target date fund” level of fees on top of the fees that each of the funds that it holds charge. This double-feeing can spell disaster for a portfolio’s performance.
In sum, the decision of which asset classes to invest in is just as important as which specific assets to invest in. The adage of “more that 90% of returns” coming from asset allocation greatly overstates and misrepresents the issue. How assets are allocated is usually based on time to retirement, where the portfolio is made more conservative as time passes. While target date funds can charge hefty fees for this movement of funds, we believe it should be included in active managers’ or 401(k) providers’ services.