The Second Quarter of 2022: More Work to be Done
By: Eric Schopf
If the first quarter was a struggle for the financial markets, the second quarter was just plain painful. Two additional interest rate increases by the Federal Reserve have heightened awareness for a potential recession, and the stock market reaction was a 16.2% retreat in the Standard & Poor’s 500 Index. The bond market provided some protection but still delivered negative returns. Yields on the 10-year United States Treasury note moved from 2.32% to 2.97%. The Bloomberg US Intermediate Government/Credit Index, which tracks the performance of intermediate term U.S. government and corporate bonds with an average maturity of about 4.5 years, declined 2.37% during the quarter. For the year, the S&P 500 has declined 19.96% and the Bloomberg fixed income index is down 6.77%.
Inflation, which has bedeviled the Fed for five straight quarters, continues to be the issue. Recessionary concerns are well founded since eleven of the past fourteen rate hike cycles by the Fed have resulted in recessions. In June, consumer price inflation exceeded 9% on a year-over-year basis, and we haven’t seen inflation at these levels since 1980. The genesis of the current bout of inflation was excess stimulus during the pandemic. In the 1960s and 1970s, inflation was brought about by a combination of deficit spending and tax cuts to spur the economy, Vietnam War expenditures, Great Society programs and supply shocks resulting from the Organization of Arab Petroleum Exporting Countries oil embargo. In both instances, it was the excessive money printing that led to inflation. From 1965-1981, inflation was running at an annual rate of 7%, and higher prices became part of expectations. It took a bold move by Fed chairman Paul Volker to finally bring inflation under control by raising interest rates to 22% in December 1980.
The Fed has no intention of letting inflation get out of control and wants to prevent inflation expectations from becoming embedded into the mindset of consumers and businesses. Unfortunately, they have limited tools for dealing with the issue. Their goal is to reduce demand for goods and services by raising interest rates, and although they have raised rates three times this year, they still have work to do based on the June inflation data. Their dilemma is that some of the inflationary pressures are supply concerns rather than demand issues. Shortages of products sourced from Asia have reduced output, and China’s zero-Covid policy will not help matters in the near term. The disruptions of Russian energy supplies and Ukrainian agricultural products, among other exports, show no signs of improvement. Desperate times require desperate measures, and Saudi Arabia is the biggest and most important member of the Organization of Petroleum Exporting Countries (OPEC). President Biden’s visit to Saudi Arabia, however, did not yield an agreement with the Saudis about pumping more oil and increasing the supply.
The level of interest rates needed to constrain enough demand to lower inflation is difficult to determine. Cash accumulated by consumers during the pandemic has allowed them to absorb higher prices so far. Estimates put excess consumer savings between March 2020 and January 2022 at $2.5 trillion. The size of the U.S. economy in 2021, as measured by gross domestic product, was $23 trillion, so this savings level provides a material cushion. Strong employment growth is another sign that the Fed hasn’t gone far enough. Payroll employment increased by 372,000 in June, and the unemployment rate was just 3.6%. This was on top of employment gains of 368,000 in April and 390,000 in May. These are not numbers associated with a weak economy. If consumers are willing to burn through their savings, and if the employment situation remains robust, it may take more time and higher rates to reduce inflation to desirable levels.
The strong U.S. dollar is helping to reduce the impact of inflation because a strong dollar drives the prices of imported products lower. The conversion rate of U.S. dollars to euros now stands at parity: one dollar buys one euro. When the euro was launched in 2002, it took one dollar to buy 0.9 euros. At the peak in 2008, it took $1.56 to buy one euro. The dollar has also strengthened against the Japanese yen.
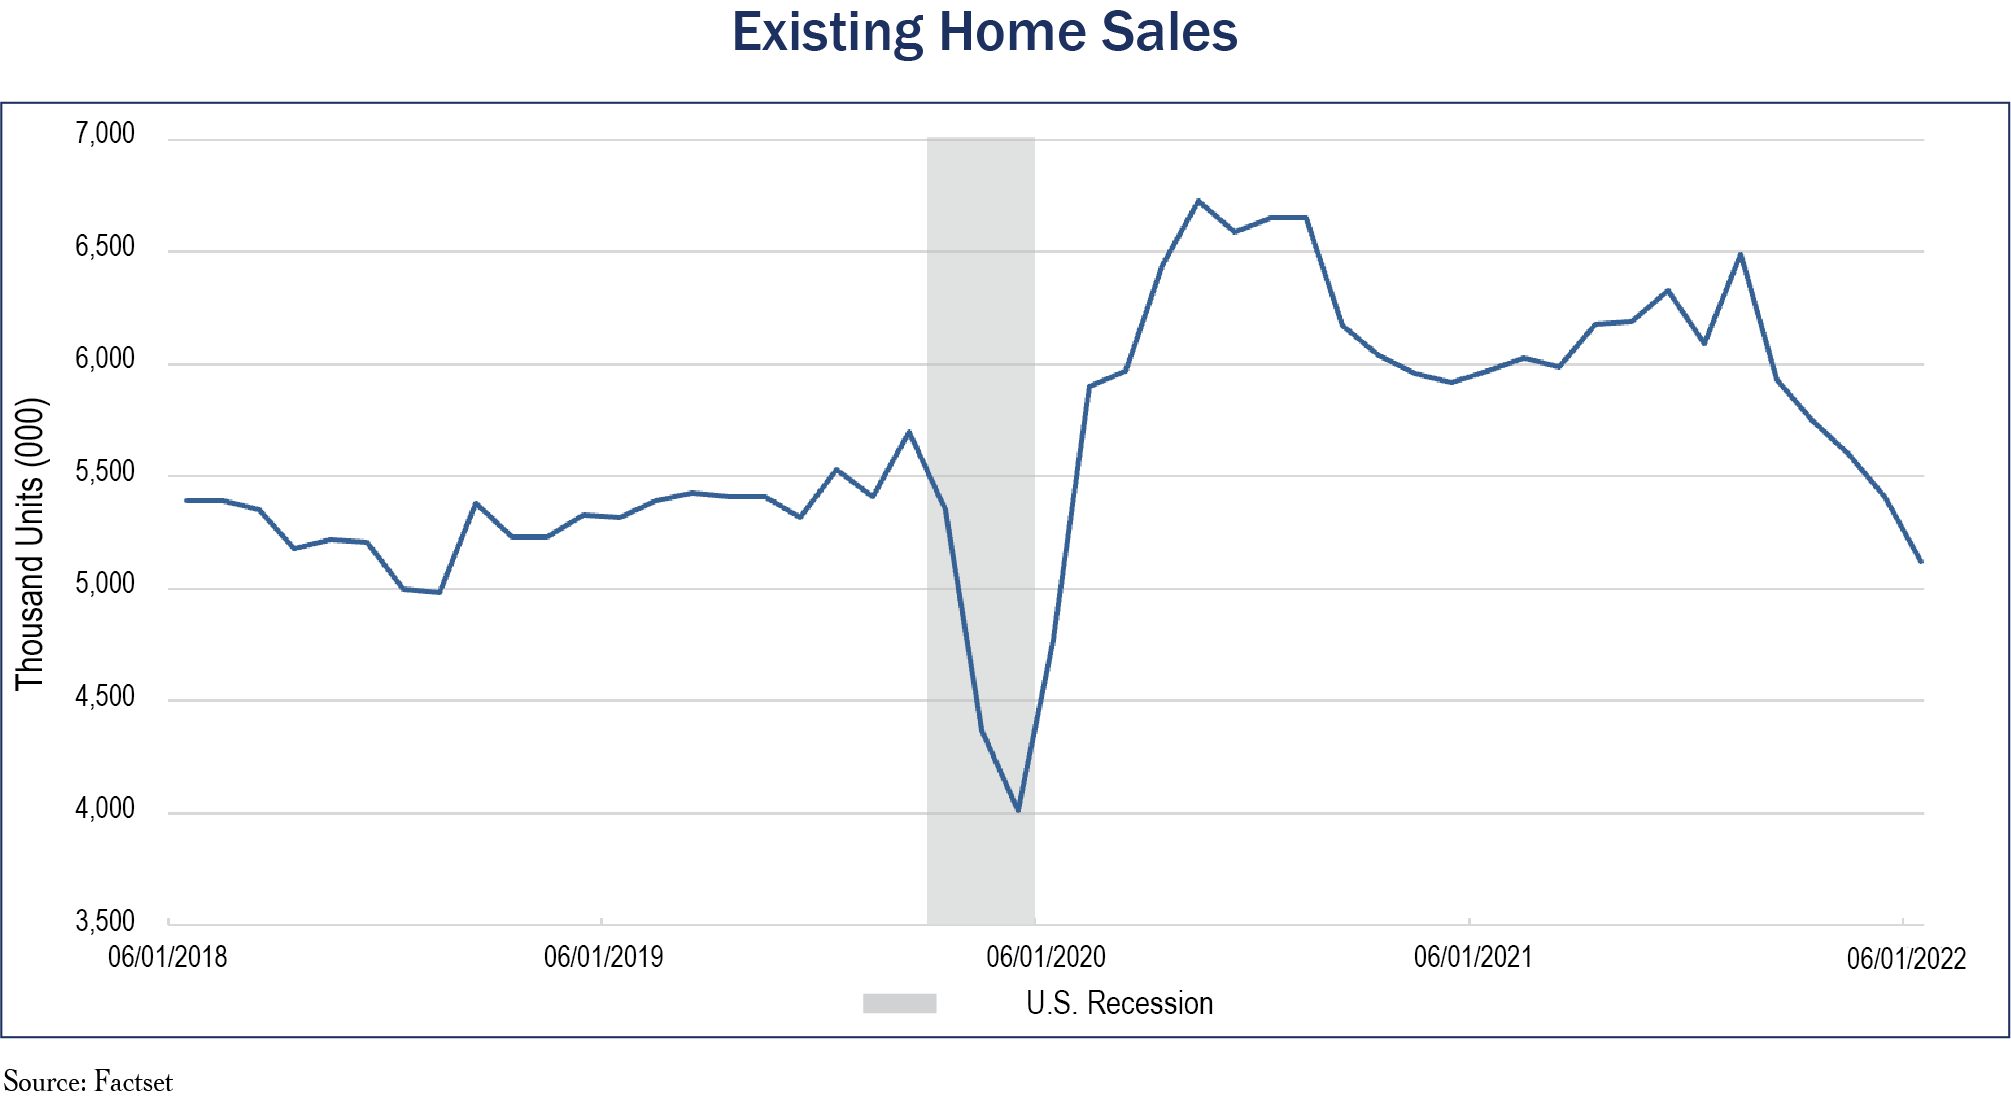
In spite of all the pain, we are beginning to see signs that higher interest rates are having some of the desired effect. Soaring interest rates and higher prices have led to a downturn in existing home sales (please see chart on page 3). Sales peaked in January and have fallen every month since. Credit quality is also beginning to fray, and credit card delinquencies and auto loan defaults are beginning to creep higher.
Beyond moves by the Fed, the best cure for high prices are high prices. Consumer buying power has eroded as wage increases have lagged behind consumer inflation. The drop in real (inflation adjusted) purchasing power corresponds with less buying by consumers. This is showing up in retail sales data. As expected, consumer confidence has also eroded. The expectations component of the Consumer Confidence Index, which reflects the short-term outlook for income, business and labor market conditions, is at its lowest level since March of 2013.
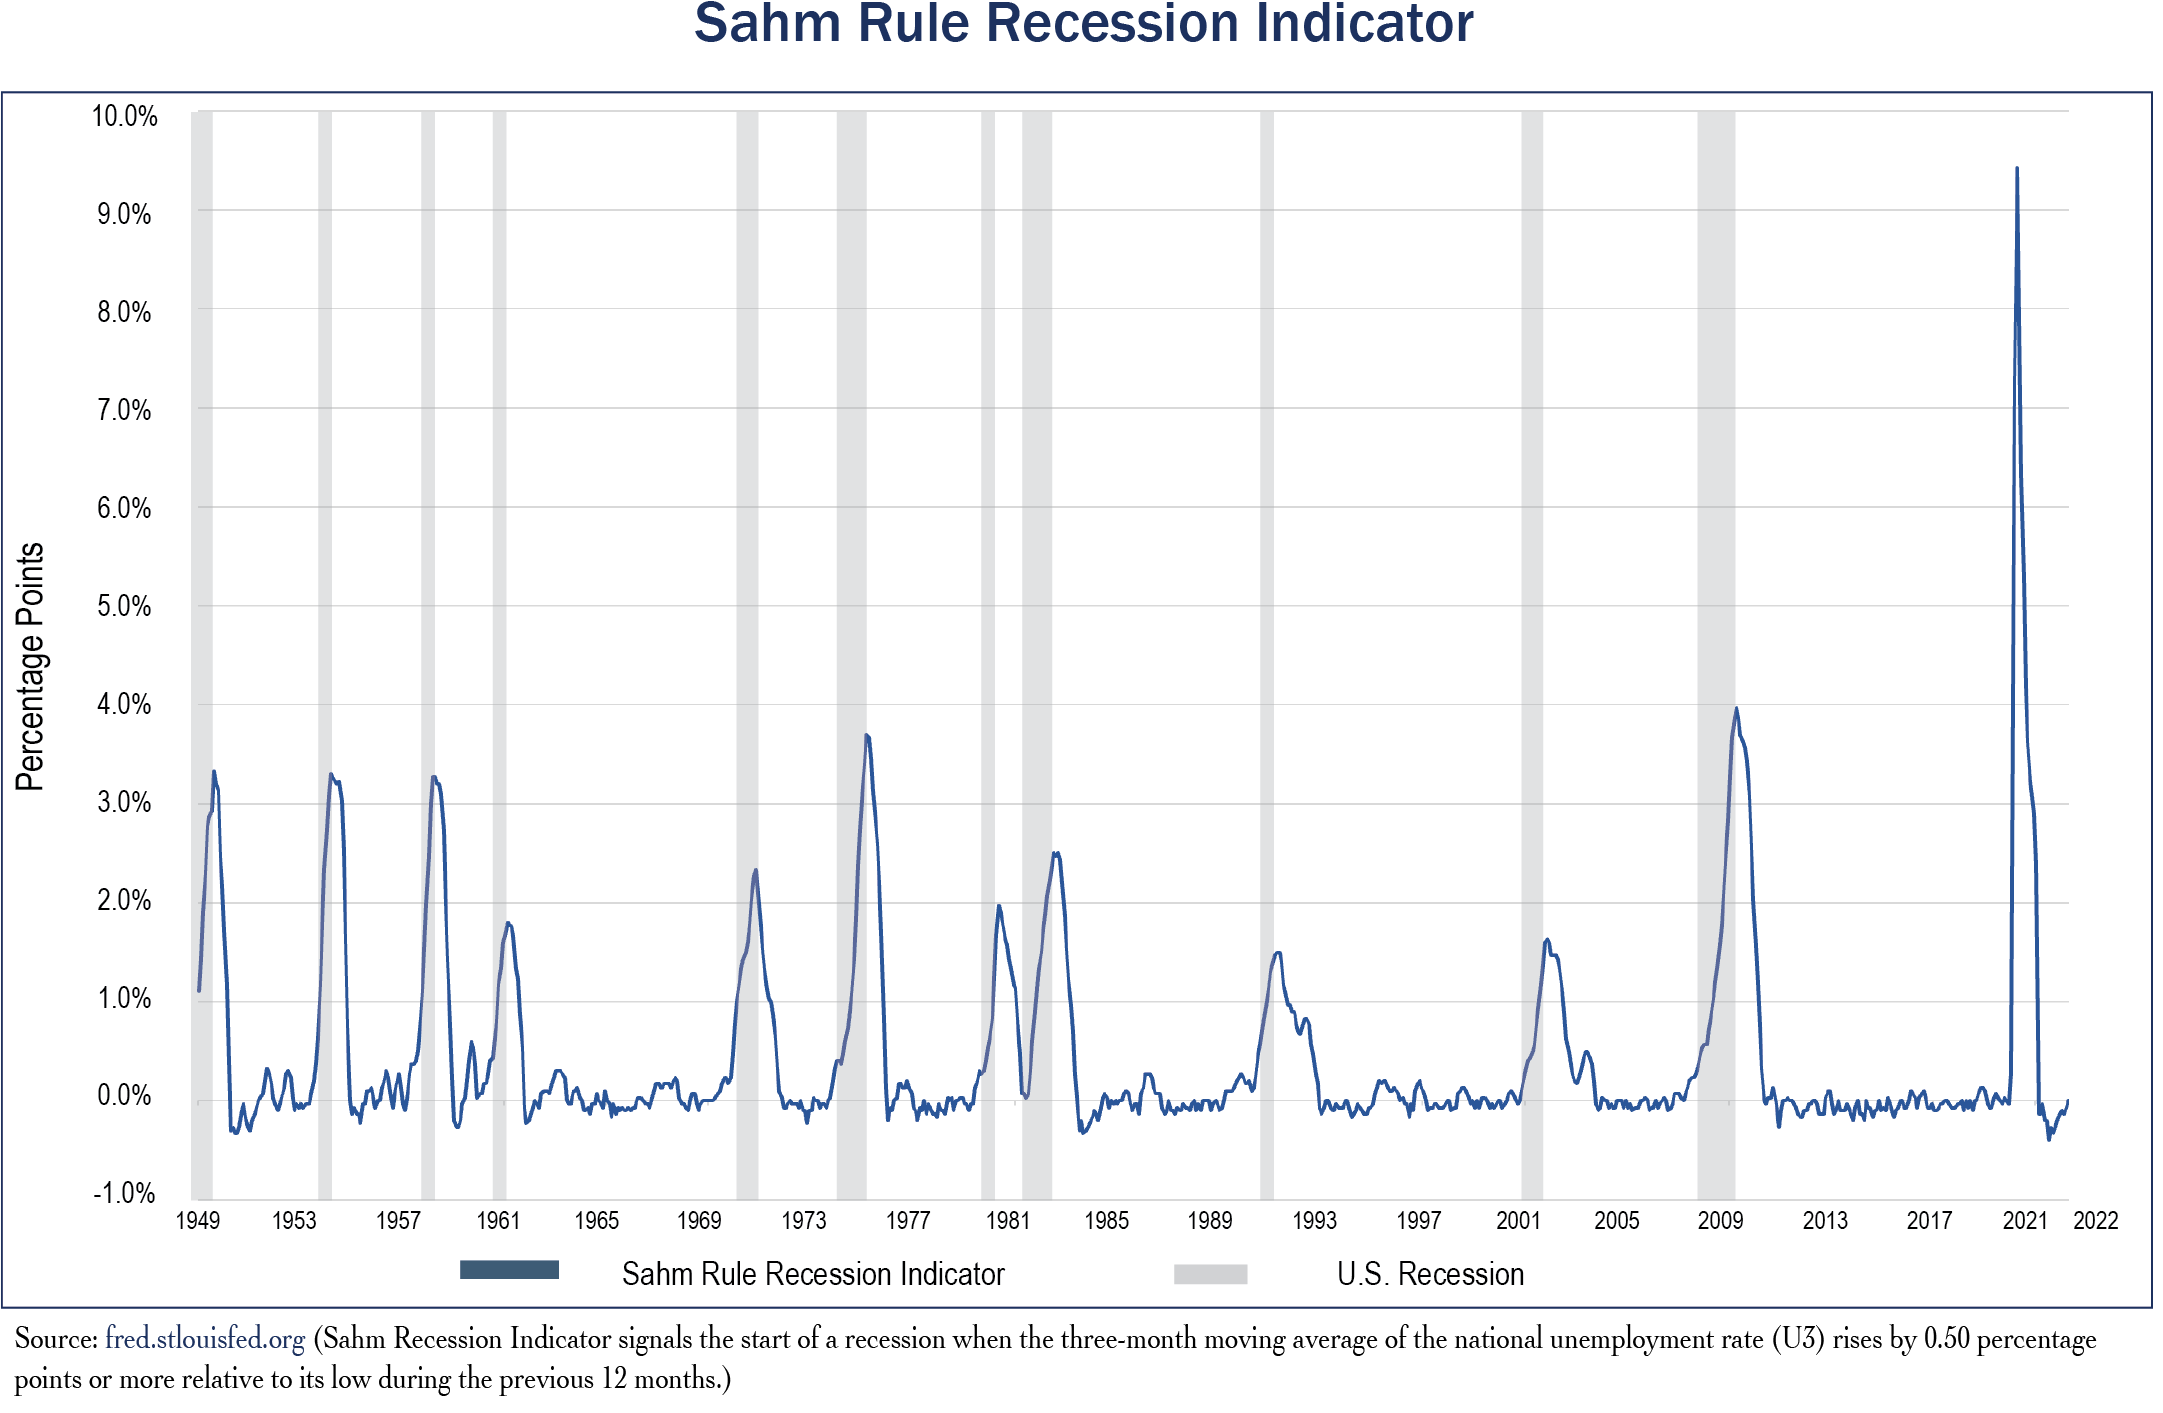
We continue to look at the yield curve and employment levels to gauge recessionary risk, and we focus on the three-month / ten-year treasury spread portion of the yield curve. Inversion, when the three-month rate exceeds the ten-year rate, is a very good sign that we may be in, or close to, a recession. Employment conditions, nevertheless, provide a much better economic picture. For this indicator, we turn to the Sahm Rule Recession Indicator (please see page 2). There has never been an increase in the unemployment rate of more than 0.3% on a three-month rolling average basis that wasn’t associated with a recession. Although the yield curve has flattened considerably this year, it does not currently portend a recession, and employment is nowhere close to recessionary levels. However, these are all subject to change as the Fed still has work to do, and future interest rate hikes may prove to be the straw that breaks the camel’s back. Quantitative tightening by the Fed has not yet begun in earnest. Initial balance sheet runoff will be $47.5 billion/month in June, July and August, increasing to $95 billion/month in September. Market pressures to clear the market may push rates even higher.
Despite the conflicting economic signs, the stock market is well on its way to reflecting a full bear market. Over the past forty-four years, there has been a bear market once every 6.3 years. The average decline has been 34.9%, so we may be in for more downside. The economy and the stock market are on a knife’s edge. Although we face challenges ahead, we continue to focus on corporate fundamentals and valuations as we manage your portfolios to meet your long-term investment objectives.