Bear Markets and the Probability of a Recession
By: Scott Murphy
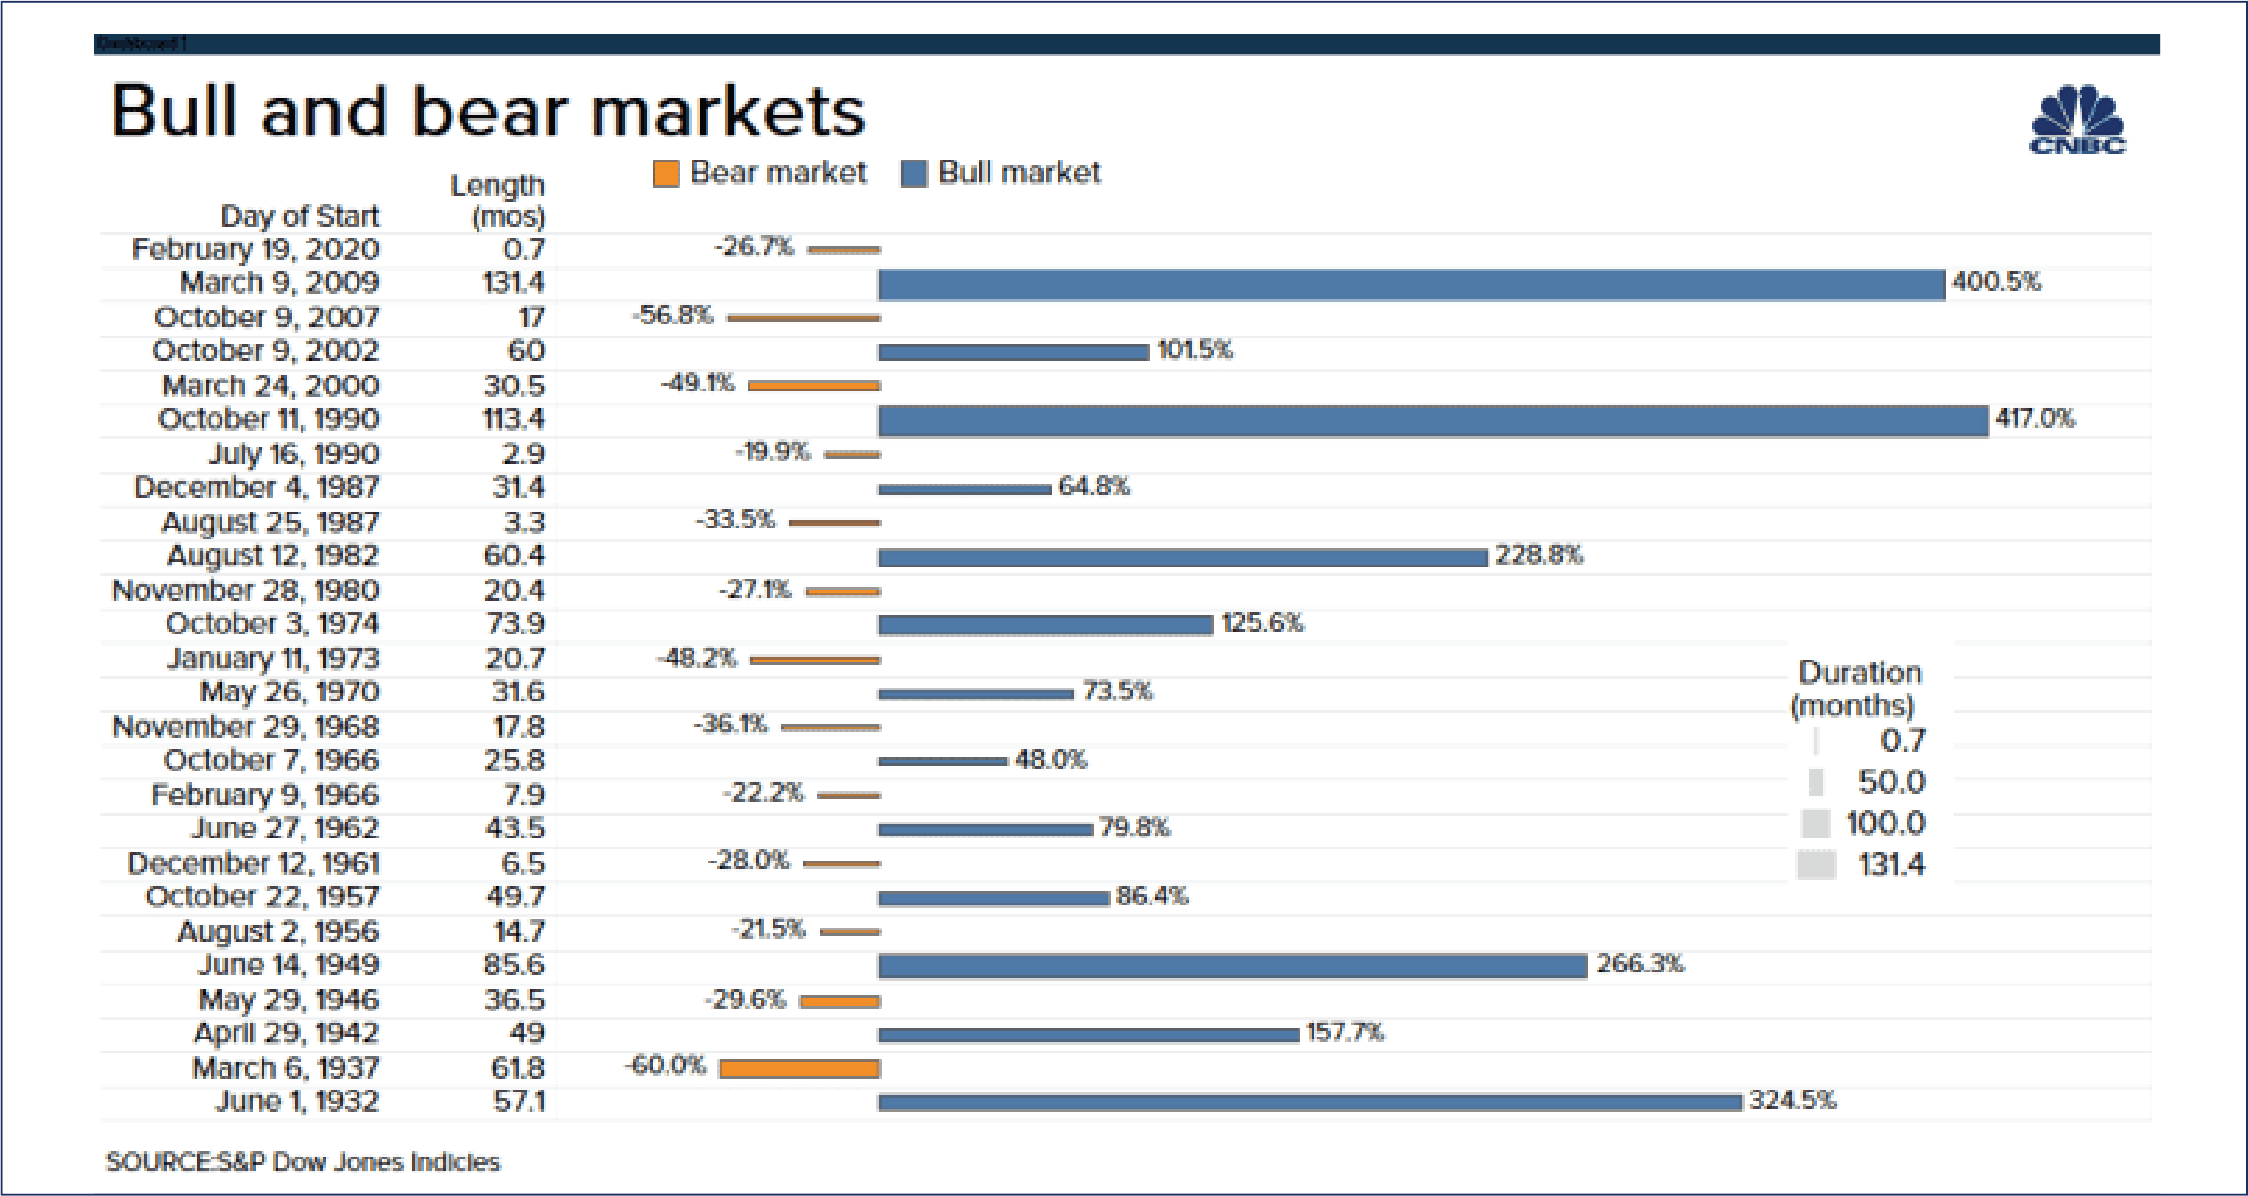
On June 13th, the S&P 500 tumbled into a bear market. It fell about 20% from the most recent high reached in January of 2022. In the post-World War period from 1945 to the present, there have been fourteen bear markets, ranging in length from one month to 1.7 years, and in severity from a 20.6% drop to a 57% decline in the S&P 500.
History tells us that bear markets happen every three to four years, and on average, they tend to come in all shapes and sizes, showing significant variations in depth and duration. The most recent bear market was due to the Covid-19 pandemic in 2020, and it lasted approximately twenty-three trading days until the bottom was reached in late March, notching the shortest bear market ever. Conversely, the bear market following the financial crisis in 2008/2009 was seventeen months in duration, with a decline of approximately 57%.
Now, as the Federal Reserve begins to raise interest rates to fight the fastest growing inflation rate in decades, there are concerns among investors that the moves will cause the economy to dip into a recession. Recessions have often followed bear markets, but one does not necessarily cause the other. Given the swiftness of this most recent market pullback, history may be on our side by demonstrating that this bear market could recover faster than others. According to CFRA Research, over half of the bear markets since World War II have preceded a recession, and those that did not lead to an economic downturn tended to last for a shorter time on average. Perhaps the most positive point of this bear market so far is the 161 days it took to go from its peak in January of 2022 to a 20% decline, compared to an average of 245 days from peak to bottom in past bear markets. Based on historical returns since 1945, a quick descent into a bear market often tends to signal more “shallow” declines rather than “mega-meltdowns” of 40% or more.
There are other data points that show the current bear market may be a shallow one. The five past bear markets where the S&P 500 reached a 20% decline in below average time (1961, 1966, 1987, 1990 and 2020), the average decline ended up being less than 27%. In all fourteen bear markets since 1945, the S&P 500 fell by an average of 32% and took an average of twelve months to find a bottom while fully recouping those losses within an average of twenty-three months, according to CFRA data.
Where do all of these bear market statistics leave us, and what do we do going forward? First and foremost, as long-term investors, we stay the course and wait for the inevitable recovery to occur. Major portfolio changes and rebalancing of portfolios should always be handled, if possible, during stable times when the market is not in disarray. Using history as a guide, we need to focus on the historical average of past recovery periods of twenty-three months to return to past market highs. We can then begin to see how long it might take to recoup the losses suffered during the current market downturn. We should take solace in the fact that bull markets last much longer than bear markets, and it is these periods of rising values that lead to outsized returns and the building of long-term wealth.